Two stocks. Same market. Very different outcomes.
Pull up any two charts from the same six-month period. One gained 40%. The other is flat. Same economy, same interest rates, same headlines.
Why the difference?
Something is driving money into one stock and not the other. If you could measure that difference — rank every stock by how much it's outperforming — you'd have a powerful filter for finding where institutional money is flowing.
That's exactly what Relative Strength Rating does.
What RS Rating actually measures
Forget the name for a moment. Think about what you'd want to know: which stocks are winning the race?
RS Rating is a percentile ranking. It compares one stock's price performance against every other stock over the past 12 months, then assigns a number from 1 to 99.
An RS Rating of 85 means that stock has outperformed 85% of all other stocks in terms of price change. An RS of 30 means it's lagging most of the market.
It's a relative measure. Not "is this stock going up?" but "is this stock going up more than everything else?"
How it's calculated
The standard approach (popularized by Investor's Business Daily) weights recent performance more heavily:
- 40% — most recent quarter
- 20% — quarter before that
- 20% — two quarters ago
- 20% — three quarters ago
This weighting catches acceleration. A stock that was mediocre six months ago but exploding in the last three months will show a rapidly rising RS Rating — exactly the kind of behavior that precedes big moves.
The raw performance score gets converted to a percentile rank across the full stock universe. That's your 1-99 number.
Reading the number
Here's how to think about different RS levels:
- RS 90-99 — Elite performers. Top 10% of the entire market. These stocks are seeing aggressive institutional accumulation.
- RS 70-89 — Strong. Outperforming most stocks. Institutions are likely building positions.
- RS 50-69 — Average. Moving roughly in line with the market. No edge here.
- RS below 50 — Lagging. Underperforming more than half of all stocks. Institutions are likely distributing or ignoring these.
The trend matters as much as the level. An RS Rating rising from 60 to 80 over six weeks tells you something is changing — money is rotating in.
Why RS matters: momentum is real
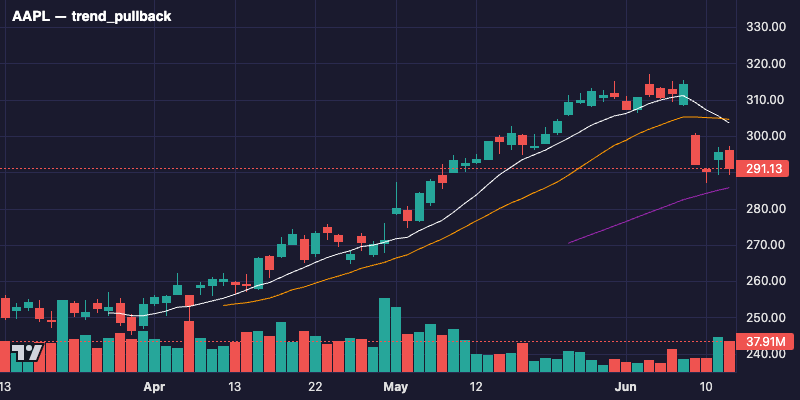
Here's the uncomfortable truth for efficient-market believers: stocks that are outperforming tend to keep outperforming.
This isn't mysticism. It's institutional behavior.
When a large fund decides to buy 2 million shares of a stock, they can't do it in one trade. They accumulate over weeks or months, creating sustained buying pressure. That sustained buying shows up as rising relative strength — long before the position shows up in any 13-F filing.
Academic research backs this up. The "momentum factor" is one of the most robust and persistent anomalies in financial markets. Stocks in the top RS decile consistently outperform stocks in the bottom decile over the following 3-12 months.
Why? Because the forces that created the outperformance — institutional accumulation, improving fundamentals, sector rotation — don't reverse overnight. Momentum persists because the underlying causes persist.
The IBD connection
Relative Strength Rating was popularized by William O'Neil and Investor's Business Daily (IBD) as part of the CAN SLIM methodology. O'Neil's research showed that virtually all great winning stocks had RS Ratings of 80 or higher before their major price runs began.
That's the key insight: high RS is a leading indicator of future outperformance, not a lagging one. The stock is already showing you that institutions are interested — the only question is whether it sets up a good entry point.
RS Rating vs RSI — don't confuse them
This trips people up constantly:
RS Rating (Relative Strength Rating) — compares one stock's performance against all other stocks. It's a ranking. "How is this stock doing relative to the entire market?"
RSI (Relative Strength Index) — measures a stock's momentum against its own recent history. It's an oscillator. "Is this stock overbought or oversold compared to itself?"
Completely different tools answering completely different questions. You can have a stock with a high RS Rating (outperforming the market) and a low RSI (temporarily pulled back from recent highs). In fact, that combination is often exactly what you want — a strong stock offering a discounted entry.
When RS fails
RS Rating isn't magic. It breaks down in specific scenarios:
Late-cycle momentum traps. A stock can have RS 95 because it ran 200% in six months — but that run is exhausted. Extremely high RS at a parabolic peak is a warning, not a buy signal. Context matters.
Sector rotation. When money rapidly shifts out of a sector, every stock in that group sees its RS collapse regardless of individual fundamentals. Last month's RS 90 becomes next month's RS 60 as the tide goes out.
Bear markets. In broad market declines, high-RS stocks often just mean "falling less." The ranking still works mechanically, but "best of the worst" isn't necessarily a good trade.
Low-float squeezes. A small stock can spike 300% on a short squeeze, giving it an artificially inflated RS Rating that has nothing to do with institutional accumulation. Volume context helps here.
The lesson: RS Rating is a filter, not a signal. It narrows your universe to interesting stocks. You still need chart context, market regime awareness, and a defined setup before acting.
How PaperEdge uses it
PaperEdge calculates relative strength rankings daily across its coverage universe. When you see a signal on PaperEdge, the RS data is baked into the analysis — only stocks showing genuine institutional-quality relative strength make it through the filter.
This saves you the screening step. Instead of manually ranking hundreds of stocks, you see the output: which strong stocks are setting up right now, in the right market context.
Try it yourself
Go to the Finviz screener. Under the Technical tab, filter for Relative Strength (RS) Rating > 80. Now look at what shows up.
Notice what sectors dominate the results. Notice how clustered they are — relative strength tends to group by sector because institutional money rotates into themes, not random individual stocks.
Pick three stocks from the results. Pull up their charts. Do you see uptrends? Do you see institutional-quality accumulation patterns? That's what high RS looks like on a chart.
PaperEdge tracks all of this automatically — join free to follow along.
Next: Understanding Market Regime →