Price moves for exactly one reason. More people want to buy than sell — or the reverse.
That's it. Every chart pattern, every indicator, every strategy you'll ever learn is just a different lens on this single truth. If you understand supply and demand at a gut level, you'll never be confused by a price move again.
Supply and Demand — The Only Driver
Forget earnings calls, Fed speeches, and analyst upgrades for a moment. Those are catalysts — things that shift the balance. But the mechanism is always the same: when buyers are more aggressive than sellers, price rises. When sellers are more aggressive than buyers, price falls.
Why does this matter? Because it means you don't need to predict the news. You need to read the imbalance.
Ask yourself: if a stock gaps up 5% on earnings but immediately sells off and closes flat — who won? The buyers had their catalyst, and still couldn't hold the price. That tells you something about the underlying demand.
What Creates Imbalance?
Think about what makes you suddenly want to buy or sell something. New information. Fear of missing out. Pain from holding a loss. A price level that "feels" cheap or expensive.
Now multiply that by millions of participants. Imbalance builds when:
- New information arrives (earnings, news, macro data)
- Price reaches a level where many traders placed orders
- Momentum attracts trend-followers who pile in
- Pain forces weak holders to capitulate
Each of these creates a temporary mismatch between supply and demand. The price moves until a new equilibrium forms.
Trend — Repeated Imbalance in One Direction
What is a trend, really? Strip away the textbook definitions. A trend is simply imbalance that repeats.
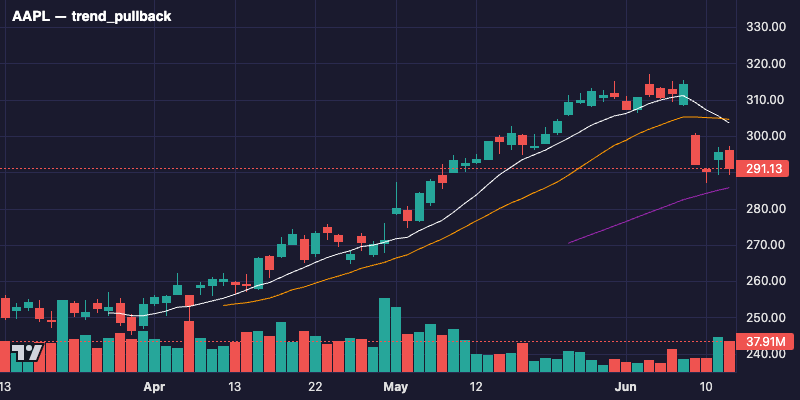
Buyers overwhelm sellers → price rises → a pause → buyers overwhelm sellers again → price rises further. Each push higher confirms that demand remains stronger than supply. The trend continues until this dynamic reverses.
This is why trends persist longer than most people expect. The same forces that created the first push — momentum, institutional accumulation, improving fundamentals — don't disappear after one move. They compound.
Support and Resistance — Price Remembers Levels
Here's a question: why would a stock bounce at the same price level multiple times? Is there something magical about $150?
No. But here's what is real: thousands of humans remember that level.
If you bought a stock at $150 and it dropped to $130, you feel pain every day. You tell yourself: "If it gets back to $150, I'm selling." You are now a source of supply at $150. Multiply this by thousands of traders, and $150 becomes resistance — a ceiling of sell orders from people who just want their money back.
Support works the same way in reverse. If a stock bounced off $100 three times, buyers remember. They set buy orders there. "It held $100 before, it'll hold again." That collective memory creates real demand at that level.
Price remembers levels because humans remember levels. This is why purely mechanical support and resistance works — it's not chart voodoo, it's crowd psychology made visible.
Volume — The Lie Detector
Price tells you what happened. Volume tells you who cares.
A stock can drift up 2% on thin volume — that's just the absence of sellers, not the presence of committed buyers. But a 2% move on three times normal volume? That's conviction. Real money is flowing.
Use volume as a lie detector:
- Breakout on heavy volume → confirmed. Institutions are participating.
- Breakout on light volume → suspect. Could reverse easily.
- Decline on heavy volume → real selling pressure. Respect it.
- Decline on light volume → likely noise. Weak hands shaking out.
Volume doesn't predict direction. It confirms whether a move deserves your attention.
Noise vs. Signal
Most daily price movement is noise. Random fluctuation driven by algorithms, day traders, and short-term reactions to irrelevant news.
How do you separate signal from noise?
- Time frame matters. A 1% daily move is noise. A 10% weekly move on volume is signal.
- Context matters. A pullback within a clear uptrend is noise. A breakdown below long-term support on volume is signal.
- Volume matters. Low-volume moves are noise. High-volume moves are signal.
The hardest skill in markets isn't finding patterns — it's ignoring the 90% of price action that means nothing. Train yourself to ask: "Is this move backed by volume and happening at a significant level?" If not, it's probably noise.
Try It Yourself
Pick any stock. Pull up a daily chart with volume bars visible. Draw a horizontal line at the most obvious price level — where price bounced multiple times. Now ask:
- Why does this level matter? Who remembers it?
- What happened to volume the last time price touched this level?
- Is the current trend moving toward or away from this level?
You've just done your first supply-and-demand analysis. Everything else builds on this foundation.
PaperEdge tracks all of this automatically — join free to follow along.