Look at This Chart
Imagine a stock that ran from $40 to $60 over three weeks. Then it stops. For the next ten days, it trades between $58 and $61. The daily ranges get smaller. Volume dries up. Nothing seems to be happening.
Then one morning, it gaps to $63 on triple the recent volume and never looks back.
What just happened?
Why This Pattern First
Of all the setups you could learn, this one has the best risk-to-reward profile for someone placing their first real trades. Here's why:
- The entry point is obvious (the breakout level)
- The stop is defined and close (just below the consolidation low)
- The move, when it works, tends to be fast and decisive
You don't need to predict anything. You just need to recognize the setup forming and act when it triggers.
What Consolidation Actually Looks Like
Forget the textbook definition. Think about what's happening beneath the surface.
A stock has moved up. People who bought lower are sitting on profits. Some want to sell. New buyers are interested but cautious — they don't want to chase. These two forces reach a temporary standoff.
On a chart, this standoff looks like a sideways rectangle. Price bounces between a floor and a ceiling. Each day's range gets a little smaller. The chart looks... boring.
That boredom is the signal.
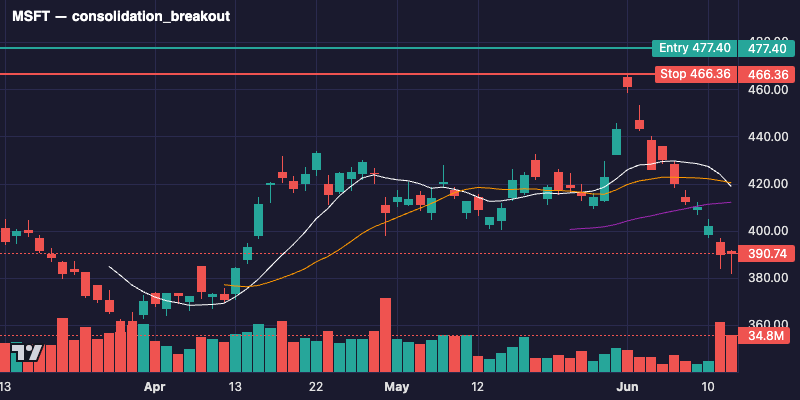
The Coiled Spring
Here's a mental model that will serve you well: think of consolidation as a coiled spring being compressed.
Every day that price stays trapped in a narrowing range, energy builds. Buyers accumulate shares quietly without pushing the price up. Sellers slowly exhaust themselves. The spring gets tighter.
When the last seller is gone, there's nobody left on the other side. The spring releases. Price moves sharply because there's suddenly no resistance above.
This isn't mystical. It's supply and demand reaching an extreme imbalance — the same force that drives every price movement. The consolidation just makes that imbalance visible before it resolves.
Three Ingredients of a Quality Setup
Not all consolidations lead to powerful breakouts. The best ones share three characteristics:
1. Volume contraction
As the pattern develops, daily volume should decline noticeably — often 40–60% below the stock's recent average. This tells you something specific: sellers are disappearing. If volume stays high during consolidation, it means there's active disagreement about direction. That's not what you want. You want apathy. Quiet. The absence of selling pressure.
2. Range compression
Early in the consolidation, the stock might swing 3–4% in a day. By the end, daily ranges compress to 1–2%. Draw the high-to-low range for each day and watch it shrink. This tightening is the spring coiling. It means buyers and sellers have reached temporary equilibrium — and equilibrium always resolves.
3. Breakout volume
The day the stock breaks above the consolidation ceiling, volume should surge — at least 50% above the recent average, ideally much more. This is the confirmation. High volume on the breakout day means institutions are participating. Without it, the move has a much higher failure rate.
All three ingredients matter. Volume drying up during consolidation + range getting tighter + volume exploding on breakout = the full signature.
Entry, Stop, and Target
Entry: Buy when price closes above the consolidation high on elevated volume. Some traders enter intraday when the stock clears resistance; others wait for the close to confirm. Either approach works — the key is that volume must be there.
Stop: Place your stop just below the low of the consolidation range. This is your "I was wrong" level. If price drops back inside the range, the breakout has failed and you cut the loss. The beauty of this pattern is that your stop is usually tight — 3–7% below entry depending on how compressed the range got.
Target: A reasonable first target is the height of the prior move (the rally that preceded the consolidation) added to the breakout level. So if the stock ran $20 before consolidating, look for another $15–20 above the breakout. Let the trade breathe — strong breakouts often go further than you expect.
False Breakouts — And How to Handle Them
Not every breakout works. Sometimes price pokes above resistance, triggers entries, then reverses back into the range. This is called a false breakout or "fakeout."
How to reduce the damage:
- Demand volume confirmation. A breakout on low volume is suspect. If volume doesn't show up, don't enter — or enter smaller.
- Wait for the close. Intraday breakouts that fail by the close are a warning. A true breakout should hold above resistance into the close.
- Respect your stop. False breakouts are why you have a defined stop. Take the small loss and move on. The next setup is coming.
False breakouts aren't your enemy — they're information. They tell you that demand wasn't strong enough yet. Sometimes the stock re-consolidates and breaks out again later, successfully.
The Best Market Context
Here's something that will save you a lot of frustration: consolidation breakouts work best when the overall market is healthy.
When the major indices (SPY, QQQ) are in an uptrend and breadth is strong, breakouts have tailwind. More setups work, follow-through is stronger, and false breakouts are less common.
When the market is choppy or in a downtrend, breakout failure rates climb dramatically. The same perfect-looking pattern that would've worked in a strong market gets sold into.
Check the regime first. Then look for patterns. Not the other way around.
Try It Yourself
Log a paper trade on PaperEdge using /trade add. Find a stock that's been consolidating for at least two weeks with declining volume. Set an alert at the consolidation high. When it triggers on volume, log the entry. Set your stop below the consolidation low. Track the outcome.
One trade won't tell you much. But after five or ten of these, you'll start to see which setups work best and develop a feel for the pattern that no article can teach you.
PaperEdge tracks all of this automatically — join free to follow along.