A Stock Falls 5% in Three Days. Is That a Problem — or an Opportunity?
Look at any stock that doubled over a year. Zoom in. You'll notice something: it didn't go up in a straight line. Every few weeks, it dropped — sometimes sharply — before resuming higher.
Those dips feel scary in real time. But in hindsight, they were the best entry points available.
So here's the question that separates experienced traders from beginners: how do you tell the difference between a dip you should buy and a dip that's the start of something worse?
Pullback vs. Reversal — The Critical Distinction
A pullback is a temporary decline within a larger uptrend. A reversal is the end of that uptrend.
They look identical at the start. Both begin with price falling. Both trigger the same fear response. But their underlying mechanics are completely different:
A pullback happens because:
- Short-term traders take profits after a run
- The stock simply needs to digest recent gains
- Weak holders get shaken out before the next leg up
A reversal happens because:
- The fundamental reason for the uptrend has changed
- Institutional buyers have finished accumulating and are now distributing
- The broader market regime has shifted against the stock
Here's how you tell them apart in real time:
| Signal | Pullback | Reversal |
|---|---|---|
| Volume on the decline | Light, below average | Heavy, above average |
| Speed of the drop | Gradual, orderly | Fast, panicky |
| Where it stops | At a key moving average | Slices through all support |
| Market regime | Still bullish/neutral | Turning bearish |
| RS Rating | Stays high (70+) | Declining rapidly |
The single most reliable clue? Volume. A healthy pullback happens on declining volume — sellers are running out of stock to sell. A reversal happens on expanding volume — big players are heading for the exits.
The Setup: What You're Looking For
A trend pullback trade has three ingredients. All three must be present:
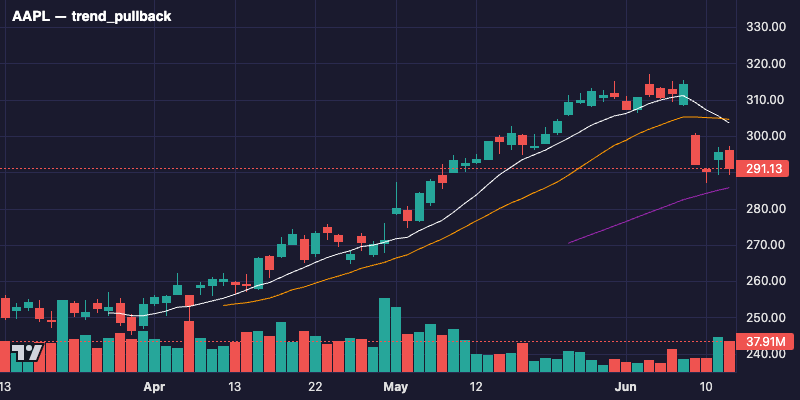
1. Clear uptrend. The stock is above its rising 20-day and 50-day moving averages. It has made higher highs and higher lows for at least several weeks. There's no ambiguity — anyone glancing at the chart would say "that's going up."
2. Pullback to a key moving average. Price retreats to the 10-day, 20-day, or 50-day moving average. Think of these averages as floors in a building. In a strong uptrend, the 10-day or 20-day acts as the first floor — price touches it and bounces. If it falls through to the 50-day, that's the basement. Deeper than that, and the trend itself is in question.
3. Resumption signs. The pullback stalls. A green candle appears near the moving average. Volume picks up slightly on that up day. Price starts reclaiming ground. This is the stock telling you: "The dip is over. The trend is resuming."
Why does this work? Think about it from first principles. An uptrend means demand consistently overwhelms supply. A pullback temporarily brings price down to a level where demand reactivates — the moving average acts as a magnet for buyers who missed the initial move. When those buyers step in, the imbalance reasserts itself.
The Volume Signature
Volume tells the whole story if you learn to read it:
During the pullback: Volume should contract day by day. Fewer shares changing hands means fewer sellers. The decline is running out of fuel. If you see three or four consecutive days of declining volume as price drifts lower — that's textbook.
On the resumption day: Volume should expand — not necessarily to breakout-level, but noticeably above the quiet pullback days. This confirms buyers are stepping back in.
Think of it like a conversation. During the pullback, the "selling conversation" gets quieter and quieter. Then a new voice enters — louder — saying "I'll buy here." That's your signal.
Entry Triggers
Don't buy the moment price touches a moving average. Wait for confirmation that the bounce is real:
- Price reclaims the short-term MA. If the stock pulled back below the 10-day, wait for a close back above it.
- A reversal candle appears. A hammer or bullish engulfing candle at the moving average, especially with a long lower wick showing rejection of lower prices.
- Next-day follow-through. The day after the reversal candle, price opens flat or higher and holds. This eliminates false bounces.
Your stop goes just below the moving average that held — or below the pullback low, whichever is tighter. This gives you a defined risk that's usually 3-5% below entry.
Why Trend Pullbacks Work
Strip it back to human behavior:
- During an uptrend, every person who sold "too early" is watching, waiting for a chance to get back in
- The moving average becomes a Schelling point — a price where buyers coordinate without explicit communication
- Market makers know this, which is why price often bounces precisely at round-number moving averages
- The pullback shakes out nervous holders, leaving the stock in stronger hands that won't sell at the first sign of resistance
It's a self-reinforcing pattern. Because traders expect the moving average to hold, they place buy orders there. Those buy orders cause it to hold. The pattern works because enough people believe it works.
Risk Management
Trend pullbacks offer one major advantage over breakout trades: your stop is closer to your entry. A breakout stop might be 5-7% below entry. A pullback stop is usually 3-5%.
This means you can size larger for the same dollar risk — or risk the same amount with a wider margin of safety.
Rules to protect yourself:
- Don't average down. If the stock breaks the moving average that was supposed to hold, the thesis is broken. Exit.
- Respect the regime. Pullback trades have the highest win rate in a bullish market regime. In neutral or bearish conditions, the "pullback" is more likely to become a reversal.
- Check relative strength. A stock with an RS Rating above 70 pulling back is very different from a weak stock pulling back. Strong stocks pull back less and bounce faster.
- Set a time limit. If the stock touches the moving average and doesn't bounce within 2-3 days, something may have changed. Reassess.
Common Mistakes
Buying the dip in a downtrend. A stock that's already below its 50-day moving average and falling is not "pulling back." It's trending down. Pullback buying only works within an established uptrend.
Ignoring volume. If the pullback is happening on heavy volume, institutions are distributing. The smart money is selling to you. This isn't a dip — it's distribution.
Buying too early. Impatience is the enemy. Entering before the bounce is confirmed means you're guessing. Wait for the resumption candle. Missing the first 1-2% of the bounce is a small price for confirmation.
Picking the wrong moving average. In a fast uptrend, the 10-day MA holds. In a moderate uptrend, the 20-day. In a slower trend, the 50-day. Match the moving average to the stock's character. If a stock has been respecting the 20-day for months, don't expect it to bounce at the 10-day.
Trading against the market. Even the strongest stock struggles to rally when the S&P 500 is in distribution. Check the regime before entering any pullback trade.
Try It Yourself
Find a stock in the PaperEdge signals channel with an "active" signal. Pull up its chart. Ask yourself:
- Is this stock in a pullback or a breakout setup?
- What moving average is it testing?
- Is volume contracting on the decline?
- Has a resumption candle appeared?
If you can answer these four questions, you already have an edge over most retail traders.
PaperEdge tracks all of this automatically — join free to follow along.